Last year, general practices across Australia entered a new era of quality improvement with the implementation of the Practice Incentives Program Quality Improvement Incentive – or as we all know it, PIP QI.
Eligible practices can receive the PIP QI Incentive payment by submitting the PIP Eligible Data Set to their local Primary Health Network – and now, we are helping your practice to provide better care for patients through regular PIP QI data reports.
The reports give you a clear visual overview of your practice’s patient demographics and quality improvement progress. They show how you’re tracking against the 10 PIP QI measures and give insight into how your practice compares to others in our region.
Why is data important?
“If you can’t measure it you can’t change it.” – Peter Drucker
Primary care practices with a strong quality improvement focus continually seek to improve their own performance and outcomes for their patients by using data to identify areas to improve, as well as measuring if improvements have been made.
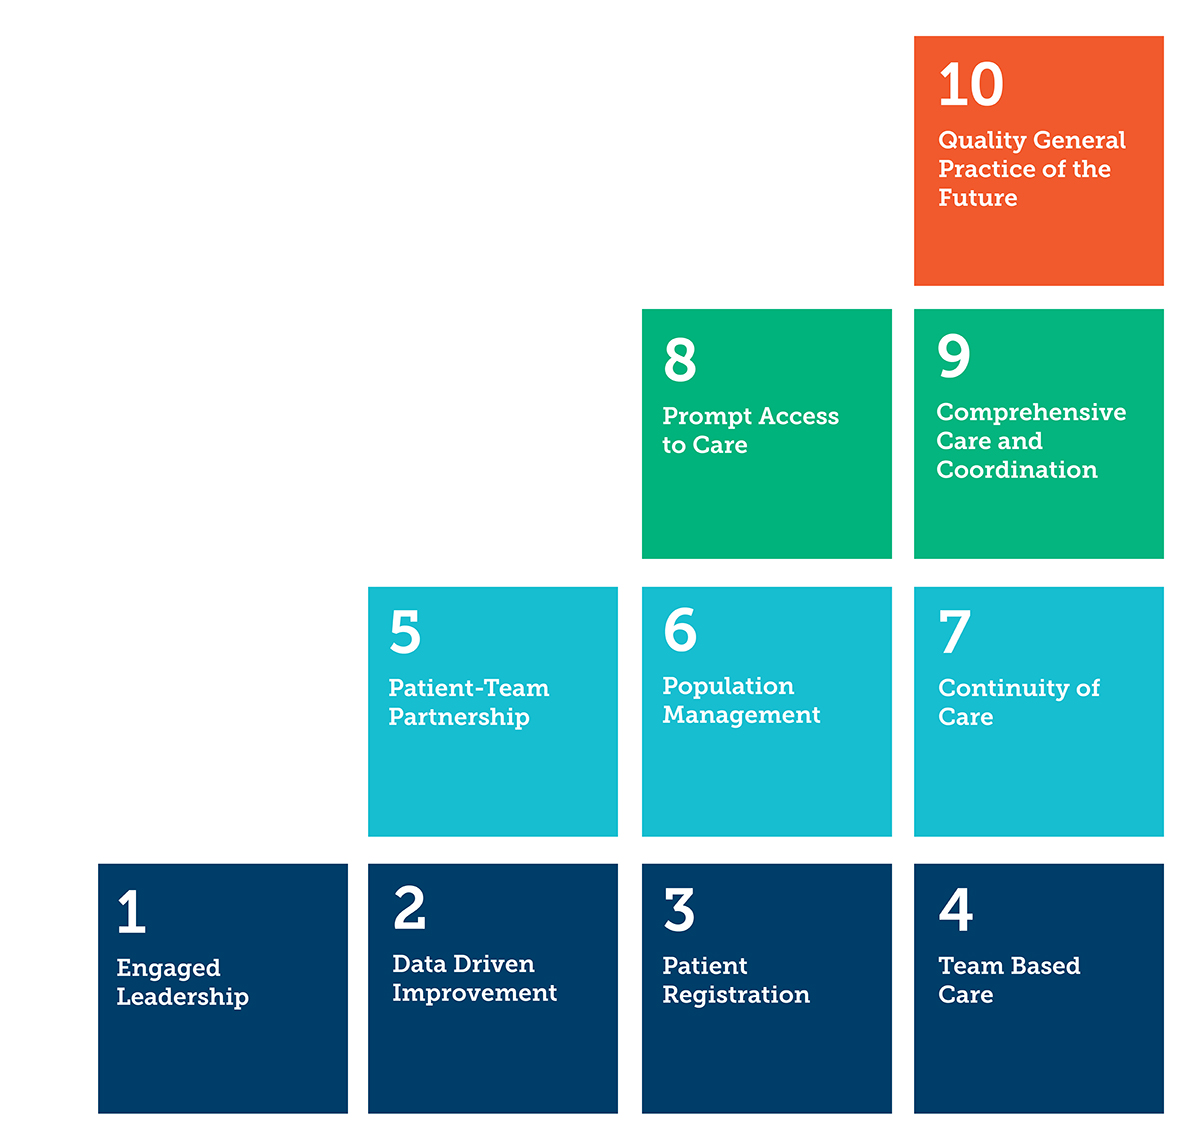
Thomas Bodenheimer and his colleagues studied high performing primary care practices, leading to a formulation of the 10 building blocks of high-performing primary care. This model identifies and describes the essential elements of primary care to facilitate high performance.
The building blocks include the four foundational elements of engaged leadership, data-driven improvement, patient registration and team-based care. These elements assist the implementation of the other six building blocks. Therefore, data is a foundational element of primary care improvement and should guide everything we do in general practice.

How do we get the data for the reports?
Our team use the de-identified data submitted that practices submit to us for the PIP QI Incentive, import it into a clever custom-designed program (developed using Microsoft Power BI) and generate each practice’s report. We consulted with local GPs and general practice to make the reports as user-friendly and practical as possible.
What’s in the reports?
There are five sections to the reports:
- A reference guide (view sample)
- PIP QI measures overview (view sample)
- Demographics (view sample)
- PIP QI measures in-depth (view sample)
- Benchmarking your practice data against NWMPHN (view sample)
The reports will be emailed to you each quarter. Then, your relationship manager will make time to check in with you or your team about the reports and to see how we can best support you to make improvements in your practice.
How can I use the reports to make improvements in my practice?
Everyone will use the reports differently; however, here are some suggestions:
- Circulate the reports to the full team and then arrange a meeting to discuss them – celebrate with the team the things you are doing well
- Use the reports to identify some priority areas for improvement in your practice. You might choose some quick wins and some more long-term goals.
- Set up a quality improvement team to work towards your goals
- Use our Quality Improvement Toolkit and brush up on your CAT4 and Topbar skills
- Use Plan, Do, Study, Act templates to document your quality improvement activities. We have a template you can download (.pdf).
- Participate in a structured quality improvement program – current opportunities are available here
- Register to attend an upcoming education event
What support is available?
We are here to help. Please reach out to our team by emailing primarycare@nwmphn.org.au
We will be providing a range of support options for practices to help your practice to get the most out of these reports. Available support includes:
- Navigating PIP QI Reports sessions with Dr Jeannie Knapp (NWMPHN GP Adviser)
- General practice visits for the whole practice team
- Virtual drop in sessions
- Over the phone or email support with your NWMPHN relationship manager
This is another important step on our data driven journey towards providing better care, every day, for everyone in our community.


