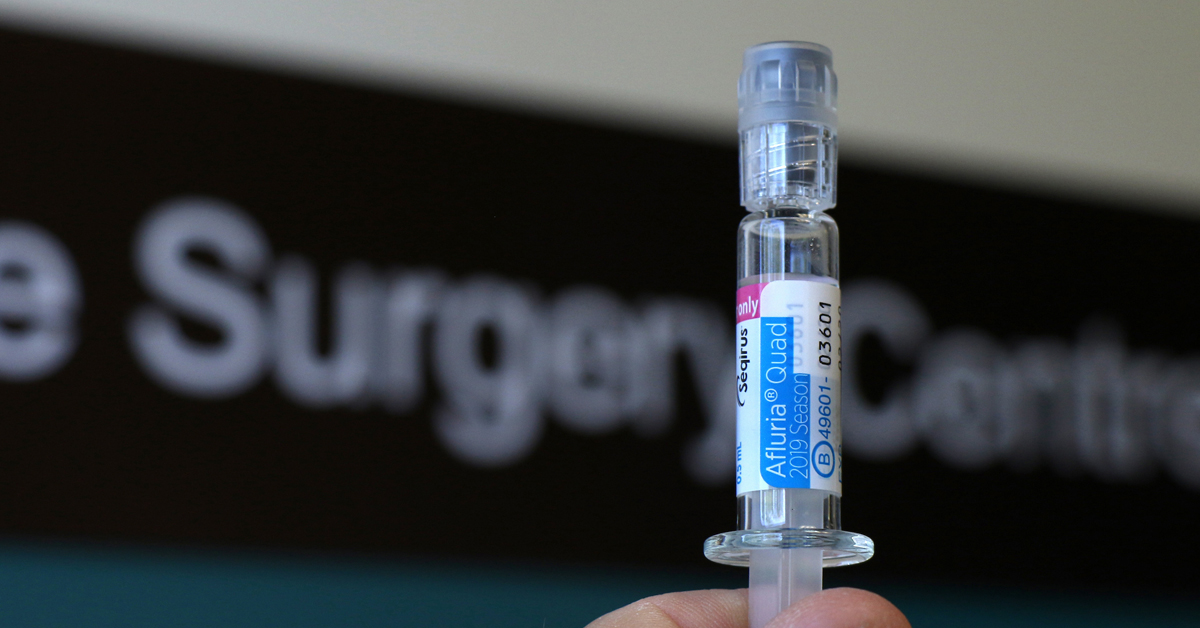
Influenza season is nearly upon us.
Eligible practices in the North Western Melbourne Primary Health Network (NWMPHN) will soon receive their second quarterly PIP QI report. These reports are full of juicy data to contemplate, reflect on and help your practice team consider data driven changes.
A quick reminder: these reports are based on the Practice Incentives Program Quality Improvement (PIP QI) 10 measures. However, you can choose any area of data driven quality improvement that you wish, as long as you are working in partnership with the PHN. The 10 measures have been chosen as evidence-based measurements and are a good starting point.
Influenza vaccines and the 10 measures
Influenza vaccine season is coming. It’s going to be a challenging one again this year, as we will be coordinating delivery of influenza vaccines and COVID-19 vaccines. There are three influenza vaccine related measures:
- Measure 4: proportion of regular patients aged >65 who were vaccinated against influenza
- Measure 5: proportion of regular patients with diabetes who were vaccinated against influenza
- Measure 6: proportion of regular patients with COPD who were vaccinated against influenza
Where to start? Choose a goal
A good place to start is to set a goal. You can reflect on the existing data in the report to choose a goal to work towards. Keep it simple and keep it doable!
If your current vaccination rate is 20 per cent, you will be setting yourself up for failure to aim for 80 per cent. It is far more gratifying for the team to have the satisfaction of reaching an achievable goal.
You might shoot for a 10 per cent improvement. Or you might aim to have your COPD rate as good as your diabetes rate. Or maybe you will focus on maintaining the same level of vaccination this year as you did in 2020, in a year when your vaccination resources may be diverted elsewhere.
Need help getting started? Visit our quality improvement toolkits page.
Choose a measure
This is an easy one as NWMPHN will do the hard work for you by producing the reports. For example, “Percentage of regular patients with diabetes who have been vaccinated against influenza by X date”.
Brainstorm some ideas
Ideally, do this with your practice team. Where you start will depend on what you are doing now. Do you want to do a data cleanse before you start? For example, you could clean “indicated diabetes but no diagnosis” and “indicated COPD but no diagnosis” using Pen CAT.
Do you already run influenza vaccination clinics? Where do you get the lists of names from? Do you send text messages to patients? How do you follow up patients who do not have smartphones? How do you manage bookings into the clinic? How do you manage staffing of the clinic? Do you use top bar to prompt opportunistic vaccinations?
There’s lots of places to start – involving your whole practice team will help get the ideas flowing.
Make a plan
Having brainstormed ideas, you are now ready to make a plan of how you are going to improve your influenza vaccination rates. Here is an example of a plan:
Goal
To improve the proportion of regular patients aged >65 who were vaccinated against influenza from 60 per cent to 70 per cent.
Measure
Percentage of regular patients aged >65 who have been vaccinated against influenza by October 2021.
Plan
These are the ideas we are going to test:
- In 2021 we are going to set up dedicated influenza vaccination clinics.
- Manager will liaise with practice nurse and GPs to set up availability and times.
- Manager will liaise with clinical team and reception about booking rules into the vaccination clinic. For example: Dr A prefers one patient every five minutes, Dr B is happy for one patient every three minutes.
- Process for booking into vaccination clinic. For example: Can the patient book directly, or do they need to book through reception?
- Manager to ensure staff availability to staff vaccination clinic.
- Manager to ensure space available for socially distanced waiting before and after vaccination.
- Practice nurse to ensure sufficient stock available, and develop a process for cancelling a clinic if stock runs low.
- Clinical team to discuss process during vaccination clinic. For example: GP seeks consent, writes notes and enters vaccine details, provide billing notes, practice nurse gives vaccine.
- Practice nurse to use Pen CAT to identify all eligible patients and generate an Excel spreadsheet of mobile phone numbers, which the practice manager will then use to send out a welcome SMS to the vaccination clinic.
- Patients who don’t have SMS capability will be sent an invitation letter instead.
- Topbar to be installed to improve opportunistic vaccination rates.
Do it, study it, and act on any changes you want to make
The final step of the Plan, Do Study, Act (PDSA) cycle is to actually do what you plan to do. This means testing your ideas, studying the results and reflecting on what happened. You can then make any necessary changes.
For example, after running the first clinic, you might realise that with social distancing requirements, patients can only be booked every six minutes to alleviate pressure on waiting areas. You can then alter your plan to reflect this.
Questions?
Our Primary Health Care Improvement team is eager to help. Please contact primarycare@nwmphn.org.au or visit our quality improvement hub for more information.


